Portfolio · Case Study

Diego S.
Data Science
Customer Segmentation
Predictive Modeling
Marketing Analytics
Education
Florida International University
BS · Computer Science
Florida International University
MBA · Marketing & E-Commerce
Pennsylvania State University
Master of Applied Statistics
Available now
100%Job Success
Case Study
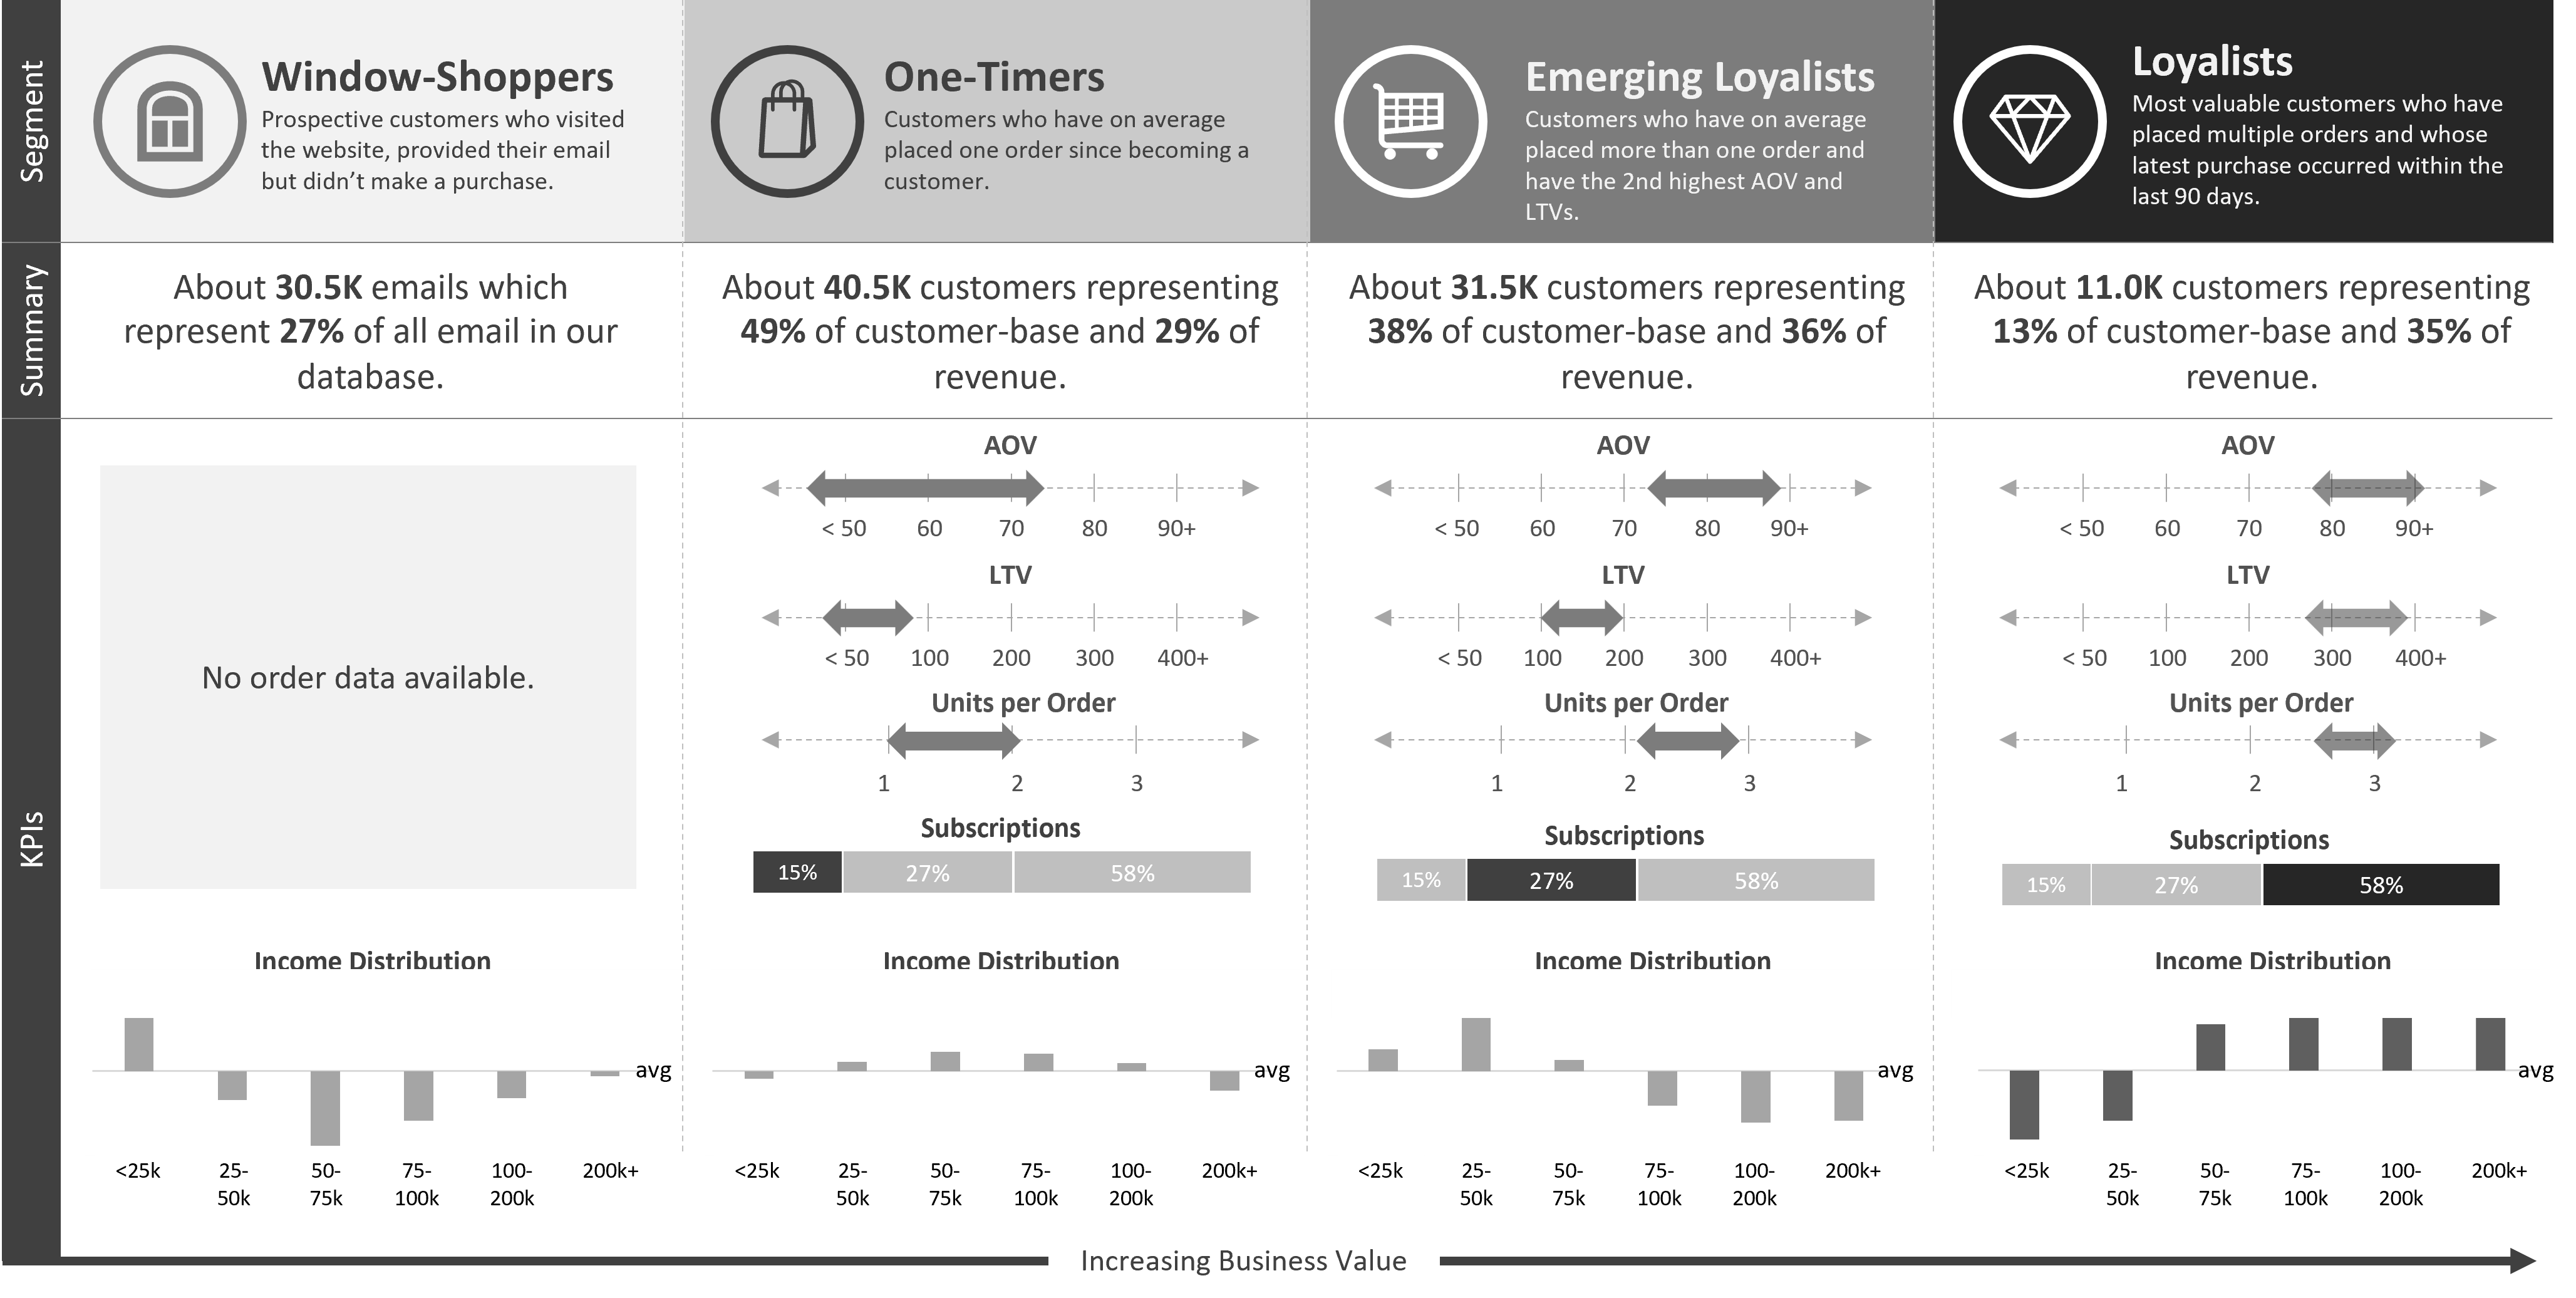
Customer Segmentation
& LTV Analytics
& LTV Analytics
83K
Customers analyzed
4
Behavioral segments
2
Storefronts (EN + ES)
01 · 09