Portfolio · Case Study

Diego S.
Diego S.
Paid Media Analytics Data Engineering Python
Education
Florida International University
BS · Computer Science
Florida International University
MBA · Marketing & E-Commerce
Pennsylvania State University
Master of Applied Statistics
Available now
Expert-VettedExpert-Vetted
Top RatedTop Rated
100%Job Success
Case Study
Paid media
analytics platform
Automotive Aftermarket Brand
Automotive Aftermarket · Online Retail
$5.06M
Attributed revenue
$709K
Ad spend
21K
Transactions
01 · 06
Project overview
What was built
Industry
Automotive Aftermarket · Online Retail
Engagement type
Consulting
Markets
US · Canada
Scope
Google Ads · Facebook · Instagram · Shopify
Technical stack
Google Ads Databricks Fivetran Python Tableau Cloud ClickMagick Neural Prophet Zoho Books
Engagement summary

Discovery sessions with the client revealed the core measurement problem: campaigns were running across dozens of car brands, products, and service types, but there was no consistent naming structure — Google Ads revenue was estimated, not measured, and there was no reliable link between an ad click and a Shopify purchase.

The first deliverable was a formal UTM taxonomy built from scratch for this product catalog: an 8-dimension encoding system covering stage, country, car brand, product category, and campaign theme at the campaign level, and car model, product, and service intent at the ad group level. A parameter guide document standardized tagging across the entire account going forward.

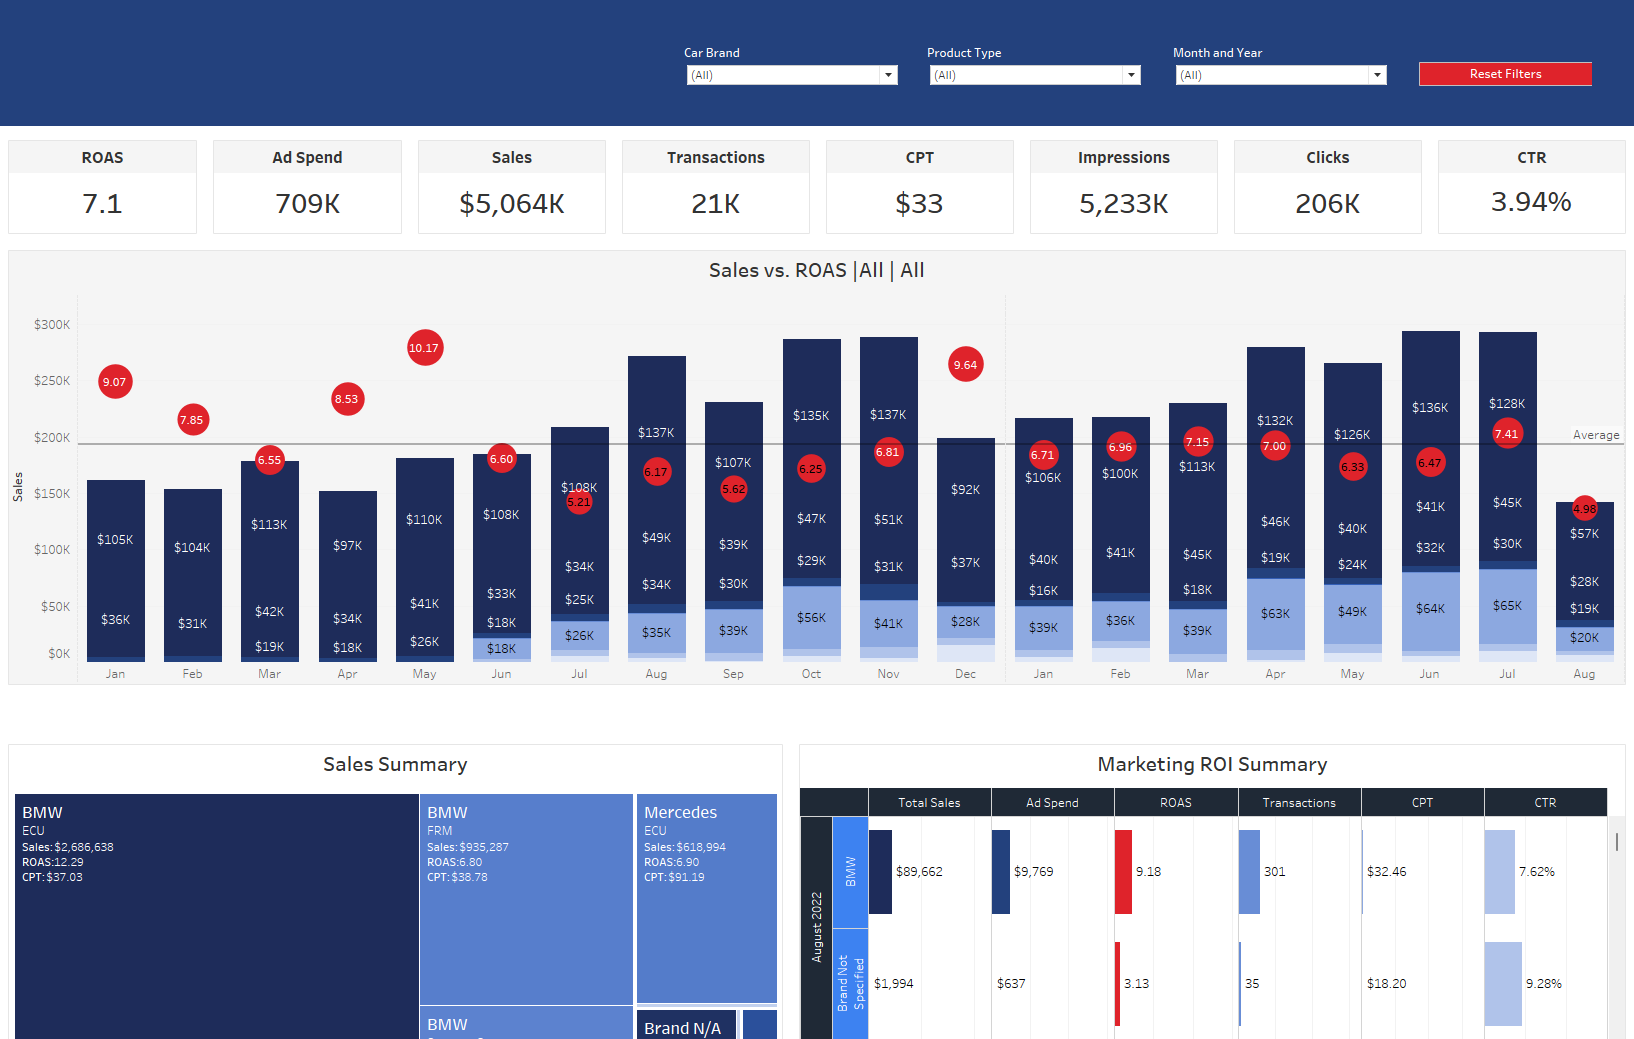
With a reliable attribution signal in place, the analytics platform was built around it: a Databricks Delta Lake lakehouse parsing five data sources, a pipeline that splits UTM strings on ingest and joins ad cost against exact Shopify revenue, five Tableau Cloud dashboard views from executive to keyword-level, and a Neural Prophet sales forecast model. The taxonomy became the operating standard for weekly paid media performance reviews — giving the account team ROAS and CPL visibility by campaign, channel, and audience segment, and turning raw Google Ads spend data into accountable, channel-level optimization recommendations.

7.1
ROAS
$709K ad spend → $5.06M in tracked sales, 21K transactions
5
Dashboard views
Executive, campaign, keyword, PMax, budget pacing
8
Attribution dimensions
Brand, model, product & service intent encoded into every click — resolved to exact Shopify revenue at purchase
02 · 06
Technical design
Analytics architecture
Data sources
Google Ads Facebook/Insta Shopify Zoho Books
Ingestion
Fivetran Python ETL RPA
Lakehouse
Bronze (raw) Silver (normalized) Gold (aggregated)
ML & analytics
Neural Prophet Competitive intel
Presentation
Tableau Cloud ClickMagick
Approach

Five data sources — paid search, social, e-commerce, and financials — unified into a Databricks lakehouse with bronze/silver/gold medallion layers. The campaign naming convention is the connective tissue: 8 dimensions encoded at campaign creation, parsed automatically at ingest, and joined against Shopify purchase events to attribute revenue at the exact brand × model × product × service level.

Key decisions
UTM parameters persist from ad click through Shopify checkout — pipeline splits utm_campaign and utm_content on - and resolves 8 dimensions with no manual ETL required
8-dimension naming encodes brand, country, product category, and theme at the campaign level — model, product, and service intent at the ad group level — every downstream filter and attribution calc derives from this structure
Neural Prophet model deployed alongside historical reporting — provides forward-looking budget planning signals
Architecture designed against the UTM taxonomy spec from day one — not retrofitted after the fact
03 · 06
Revenue Attribution · Google Ads
The Attribution Backbone
Built out of discovery sessions that revealed no consistent attribution structure existed. Eight dimensions designed for this catalog — encoded at click time, resolved to exact Shopify revenue at purchase.
utm_campaign  ·  Campaign Name
prod
stage
-
us
country
-
bmw
car brand
-
frm_cat
product category
-
generic_models
campaign theme
utm_content  ·  Ad Group Name
x5
car model
-
dme
product
-
repair
service
Car Brand
bmw mini mercedes ford freightliner paccar
Product Category
ecu_cat frm_cat sec_sys_cat cpc4_cat bcm_cat ficm_cat
Service
repair replace recall reset testing
Ad Group Type
search_standard search_dynamic_ads display_standard shopping_smart_ads shopping_product_ads
How attribution works
Every click carries both UTM strings. When a customer completes a Shopify purchase, those parameters are captured with the transaction. The pipeline splits on -, resolves all 8 dimensions, and joins Google Ads cost against Shopify revenue — producing exact ROAS at any node.
Progressive drill-down
Account ROAS
Channel (paid_search / shopping)
Country (us / ca)
Brand (bmw / mini / mercedes...)
Product cat. (ecu_cat / frm_cat...)
Model (x5 / 3_series / z3...)
Product (dme / frm / ecm...)
Service (repair / replace / recall)
"What is ROAS for BMW X5 DME repair ads in the US?" — a precise answer from actual Shopify revenue, not estimated conversions.
04 · 06
Deliverables · Measurement Foundation
Frameworks and specifications
Discovery output
Measurement framework document
Structured output of stakeholder discovery sessions: business questions by reporting persona, attribution requirements, campaign taxonomy gaps, existing data source audit, and KPI definitions. Became the specification the entire analytics build was executed against — every dashboard view, every pipeline transformation, every metric definition traces back to this document.
Attribution infrastructure
UTM parameter guide + tracking template
Formal taxonomy document defining all 8 dimensions, allowed values per dimension, naming convention rules, and a Google Sheets tracking template. Ensured consistent campaign tagging across the account from the first campaign forward — the parameter guide is the contract between campaign management and the analytics pipeline.
05 · 06
Deliverables · Analytics Suite
Dashboards and models
Ad spend vs. revenue executive dashboard
Ad spend vs. revenue
Executive ROAS, ad spend, and sales by channel and geography — with on-hover monthly detail
Campaign analytics
Campaign stats & MoM comparison
Month-over-month performance with drill-down by car brand, product category, and service intent. Because spend and revenue share the same dimensional keys, every filter produces an exact ROAS — not an estimate.
Search intelligence
Impression share & PMax analysis
Search impression share with competitor monitoring. Performance Max vs. standard campaign comparison — surfaced budget cannibalization at the product-category level, driving a campaign restructure.
Forecasting & pacing
Budget pacing & sales forecast
Neural Prophet forecast showing predicted sales vs. actuals. Budget allocation recommendations informed by model-level and service-level ROAS — not just channel averages.
06 · 06