Portfolio · Case Study

Diego S.
Diego S.
Marketing Analytics Bayesian Modeling Media Mix Modeling Data Science
Education
Florida International University
BS · Computer Science
Florida International University
MBA · Marketing & E-Commerce
Pennsylvania State University
Master of Applied Statistics
Available now
Expert-VettedExpert-Vetted
Top RatedTop Rated
100%Job Success
Case Study
Marketing
Effectiveness Platform
Bayesian MMM + BI Dashboards
Insurance
Marketing Analytics
$171M
Media spend analyzed
5
Media channels optimized
9
Data sources unified
01 · 07
Project overview
Key project facts
Client
Fortune 100 Insurance Provider
Industry
Insurance · Financial Services
Engagement type
Marketing Analytics
Approach
Bayesian MMM (PyMC-Marketing)
Scope
B2C segment · 5 channels
Technical stack
Python PyMC-Marketing statsmodels R Azure SQL Server Tableau
Engagement summary

A marketing effectiveness engagement for a Fortune 100 insurance provider, spanning two complementary deliverables. Nine marketing and business platforms — media cost, web analytics, email, CRM, call center, and policy management — were unified into a single weekly time series via an automated Python/R pipeline. On top of that dataset came both deliverables: an interactive Tableau dashboard suite — live-querying the database so marketing leadership could explore spend, leads, and conversions across segments on demand — and a Bayesian Media Mix Model to quantify what was actually driving B2C policy volume. The model, built on PyMC-Marketing, applies adstock (carryover) and saturation transforms to each channel, then fits channel contributions with a PyMC NUTS MCMC sampler — returning full posterior distributions, not point estimates: per-channel ROI with credibility intervals, contribution shares, response curves, and a budget-reallocation recommendation. The Bayesian approach captures the delayed and diminishing media effects — carryover and saturation — that the original linear regression could not.

Bayesian
Posterior Inference
Full posterior distributions per channel — ROI with credibility intervals, not point estimates
$171M
Media Spend Analyzed
Full platform across all segments; MMM scoped to B2C
5
Channels Modeled
TV · Paid Search · Display · Print · Video — each with adstock + saturation
02 · 07
Technical Design · Media Mix Model
Data & Feature Pipeline
9 Sources · Weekly Aggregation · B2C Scope
Sources
Mktg Cloud Intelligence
media cost · impressions
Google Analytics
web traffic
SLMS
policy management
Sutherland
call center
Mktg Cloud Email Studio
email · +CRM, TV, print, display = 9 total
ETL
Python + R
automated pipeline
W-SAT weekly
Saturday week-ending alignment
Channel pivot
spend → per-channel columns
Cleansing
type casts · name standardization
Target Construction
leads
raw inquiries
policies
converted
premiums
revenue
monthly ×1.5 annual ×12 LTV ×4 (assumption) groupby week
Extra Features
Holiday dummies
holidays.USA
Seasonal decompose
statsmodels
Conversion rate
leads ÷ policies
Matrix
Media matrix
5 channels weekly
Extra features
holidays + seasonality
Target
policies + premiums
~2 yrs
weekly granularity
Channels
TV
largest budget
Paid Search
Display
Print
Video
Technical Approach

Nine marketing and business platforms were unified into a single weekly time series. Media spend, leads, policies, and premiums were all aligned to a Saturday week-ending boundary so media activity and conversion outcomes share the same calendar. The target (policy volume) and a set of extra features — US holidays and seasonal components — were assembled into a model-ready matrix scoped to the B2C segment.

Key Decisions
W-SAT weekly alignment — media spend and lead/policy outcomes are bucketed to the same Saturday week-ending so the model compares like-for-like time periods.
B2C segment scope — the model is built for one business segment, not pooled across B2C, B2B, Agent, and Broker. Media-to-conversion dynamics differ too much to pool.
Holiday + seasonal features — calendar effects are modeled explicitly so media coefficients aren't contaminated by seasonality.
03 · 07
Technical Design · Media Mix Model
Bayesian Media Mix Model
PyMC-Marketing · NUTS MCMC · Adstock + Saturation
1
Inputs
Media + Features + Target
5 media channels (weekly spend) · extra features (holidays, seasonality) · target: B2C policy volume · all scaled
weekly matrix
2
Media Transform
Adstock + Hill saturation
Carryover (adstock) models delayed media effect over time · Hill saturation models diminishing returns per channel · captures the lag direct attribution misses
carryover + saturation
3
Inference
PyMC-Marketing · PyMC
NUTS MCMC sampler · tune + draws · channel priors · posterior distributions over channel effects, not point estimates
NUTS MCMC
Sampler config
NUTS warmup + samples channel priors yearly seasonality
4
Diagnostics
r_hat Convergence
Gelman-Rubin r_hat checked across chains · values near 1.0 confirm the sampler converged before any inference is trusted
r_hat ≈ 1.0
5
Model Outputs
Channel Posteriors
ROI per channel with 0.05–0.95 credibility intervals · media contribution % · response/saturation curves · baseline vs. media decomposition
credibility intervals
6
Recommendation
budget optimizer
Constrained optimization reallocates the fixed budget across channels to maximize predicted policy volume · pre/post allocation comparison delivered to marketing leadership
budget reallocation
Why Bayesian MMM

A Bayesian model returns full posterior distributions over each channel's effect — not single point estimates. That means every ROI figure comes with a credibility interval, so leadership sees the uncertainty, not just a number. Adstock and saturation transforms let the model capture delayed and diminishing media effects that linear attribution cannot.

Key Decisions
PyMC-Marketing over linear regression — the original engagement used multiple linear regression. The Bayesian approach adds adstock and saturation, modeling carryover and diminishing returns that a linear model treats as instantaneous and unbounded.
Adstock captures carryover — TV's effect persists for days after a flight. Adstock models this delay, which is why TV shows the highest contribution despite the lowest per-dollar direct ROI.
Credibility intervals over point estimates — budget decisions are made with the uncertainty visible, not hidden behind a single ROI number.
04 · 07
Model findings
TV drives the most volume — at the lowest per-dollar ROI

TV was not underperforming. Its return was delayed, and direct attribution couldn't see it.

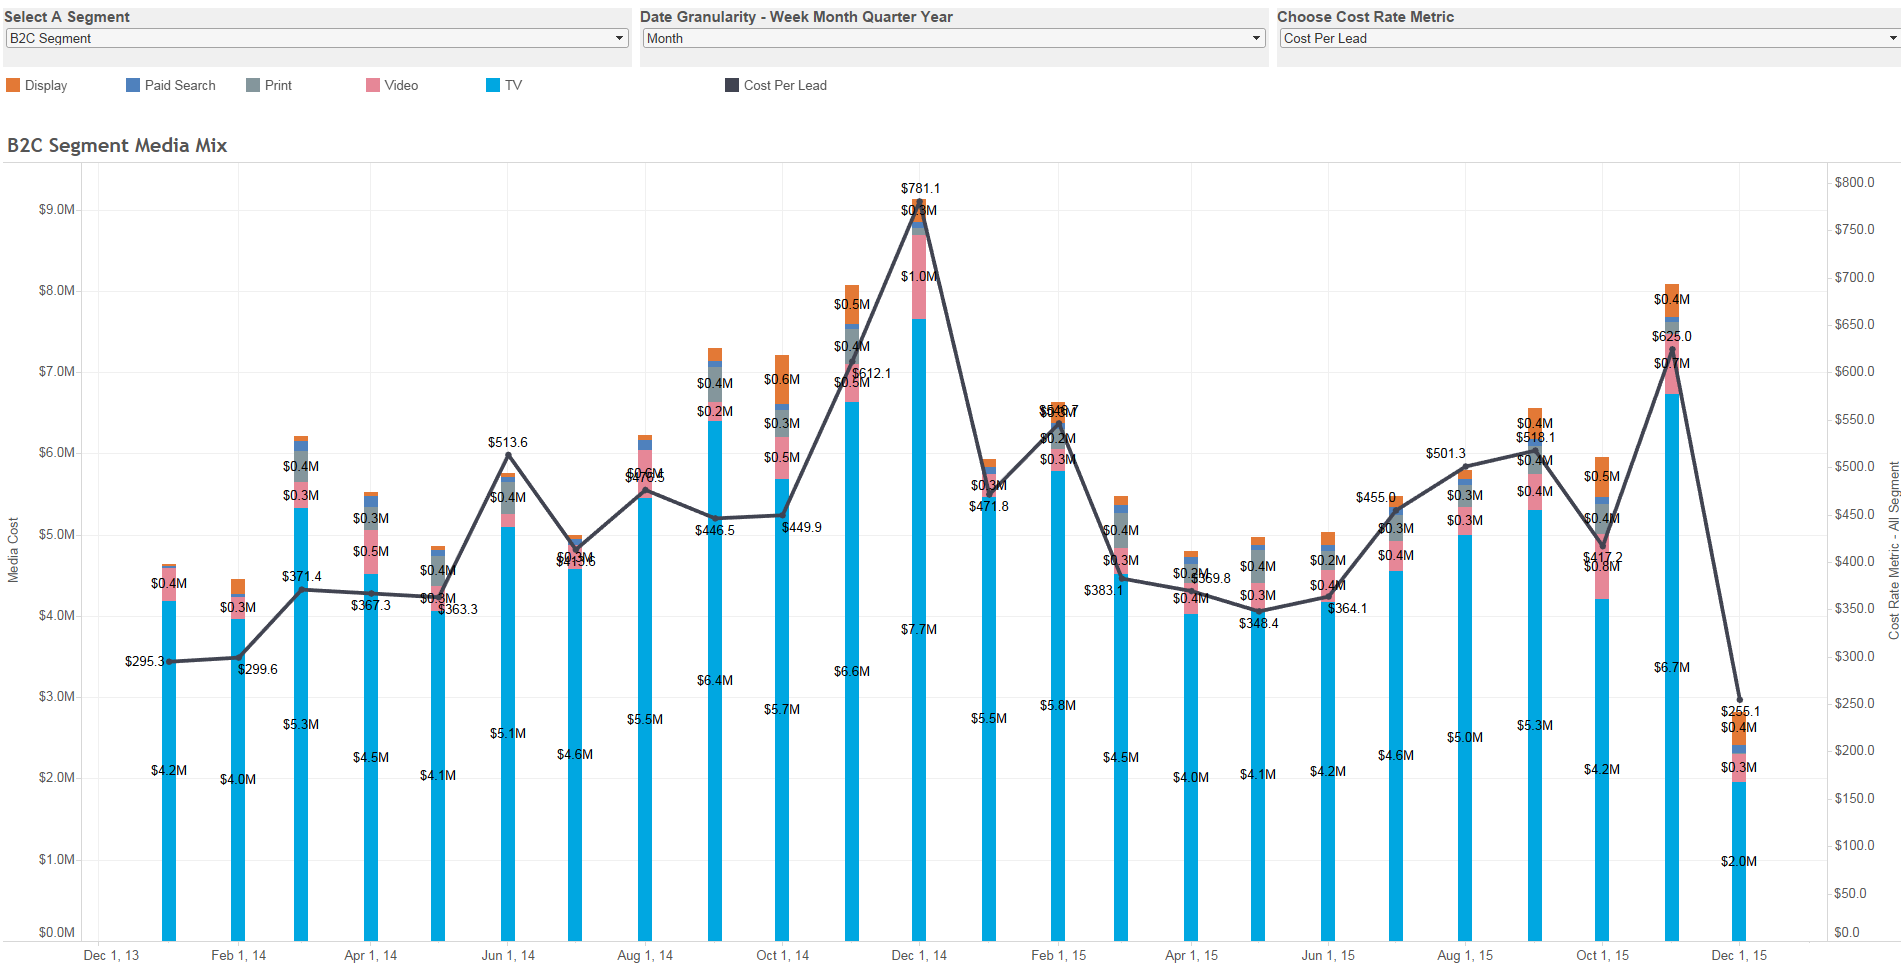
The Bayesian model estimates each channel's media contribution and its per-dollar ROI separately. TV shows the highest media contribution of any channel — yet the lowest per-dollar ROI. That tension is the whole story: TV's effect is spread out over time through adstock carryover, so a direct, same-period attribution model credits it with almost nothing. The MMM's adstock transform recovers that delayed contribution, quantifying the awareness TV generates that converts later through other channels.
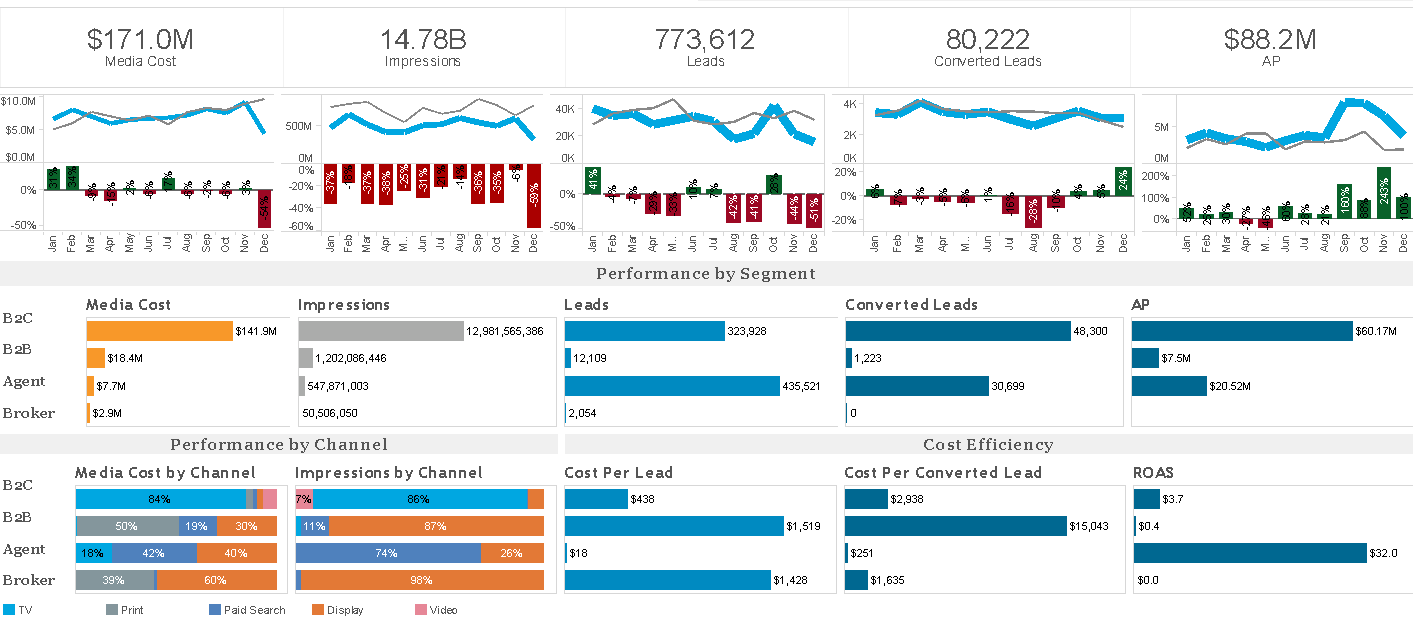
Before

Direct attribution credited paid search with conversions and TV with almost none. TV — the largest budget line — appeared to underperform, with no way to measure its delayed effect.

After

Adstock carryover quantifies TV's delayed contribution. Leadership sees channel contribution and per-dollar ROI as two separate truths — and optimizes the awareness-to-capture spend ratio, not just last-touch ROI.

Highest
TV media contribution
Largest share of modeled policy volume of any channel — recovered through adstock carryover
Lowest
TV per-dollar ROI
Direct ROI understates TV's true value because its effect is delayed, not immediate
Adstock
Carryover modeled
Adstock + saturation transforms capture the delayed media effect a linear, same-period model treats as zero
05 · 07
Illustrative model outputs
What the model produces
Actual Predicted Weekly policy volume over time
Model Fit: Predicted vs. Actual
Bayesian posterior prediction tracks weekly policy volume, with credibility band
Paid Srch Video Display Print TV Per-dollar ROI (bars = mean, whiskers = 90% credibility)
Channel ROI with Credibility Intervals
Per-dollar ROI per channel with Bayesian credibility intervals — paid search highest, TV lowest
TV Video Display Print Paid Srch Share of modeled policy volume by channel
Media Contribution by Channel
TV drives the largest share of modeled volume despite the lowest per-dollar ROI — the carryover effect
TV Video Display Paid Srch Marginal response vs. spend (normalized)
Response & Saturation Curves
Diminishing-returns curve per channel — the marginal policy volume earned at each spend level
06 · 07
Deliverables
BI dashboard views
All segments overview
All Segments Overview
Executive view — media cost, impressions, converted leads, and annualized premium by segment and channel
Media mix vs. cost per lead
Media Mix vs. Cost Per Lead
Monthly spend by channel overlaid with CPL trend — segmentable by B2C, B2B, Agent, Broker
Customer lifecycle funnel
Customer Lifecycle Funnel
Bubble KPIs mapping media cost through impressions, clicks, and form completions to converted leads
Trend & correlation analysis
Trend & Correlation Analysis
Any two KPIs compared as a dual-axis time series and correlation scatterplot, configurable by segment
07 · 07